Installation, Testing and Comparison
If you’ve ever installed a motherboard then you know it is a real pain.. but in the end it’s worth it, usually… ECS includes an SLI support bar to hold you SLI bridge in place, other than that there ins nothing extra to install with this board.
The following pictures are my final installation in a Thermaltake Armor LCS case.
The system consists of:
Intel C2D E6420
2 gigs Crucial Ballistix Tracer PC2-8500
ECS NF650iSLIT-A motherboard
3 SATA hdds (360gigs)
2 BFG 7900GT OC video cards
2 dvd-rw drives
OCZ GameXStream Power Supply
First off we’ll run through the synthetic benchmarks and compare this new system with my old system, my old system was:
AMD Athlon X2 4200+
2 gigs OCZ Spec Ops PC3200
EVGA NF4 motherboard
and the rest of the same hardware as the Intel system. We’ll see what how much of a performance boost if any we can get. Most of the Benchmarks are from SiSoft Sandra 2007, following those you’ll see 3DMarks 05 and 06 and then a couple game benchmarks, and Far Cry running is SLI and non-SLI enabled modes.
First up is Sandra 2007 Processor Cache and Memory
Combined Index: is a composite figure representing the overall performance rating of the entire Cache-Memory performance in terms of MB/s. The value is the logarithmic average of all the results for the entire address space. (Higher is better, i.e. better performance)
Speed Factor: is a figure representing the speed differential between the CPUs cache and memory. The value is the ratio of the fastest cache (i.e. L1) bandwidth to the main memory bandwidth. (Lower is better, i.e. the memory is not very much slower than CPUs cache
Well obviously the Intel setup just blows it away…
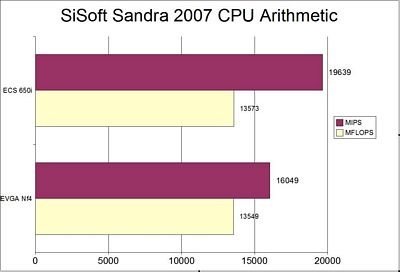
Next up we have Sandra 2007 Processor Arithmetic
Benchmarks the ALU and FPU processor units. Shows how your processors handle arithmetic and floating point instructions. Such operations are used by software in typical tasks. (Higher is better)
I’m very surprised at how close the MLOPS are actually…
The next test would be Sandra 2007 Processor Multi-Media
Benchmark the (W)MMX, SSE/2/3/4 processor units. Shows how your processors handle multi-media instructions and data. Such operations are used by more specialized software, e.g. image manipulation, video decoders/encoders, and games. The test involves the generation of Mandelbrot Set fractals that are used to realistically describe and generate natural objects such as mountains or clouds. By using various multi-media extensions (Wireless) MMX, 3DNow!, SSE(2/3/4) better performance is achieved. (Higher is better)
Well, what can I say…


