Installation and SiSoft Sandra Tests
So here are my system specs:
Motherboard: Asus P8Z68-V Pro/Gen3
CPU: Intel Core i7 2600K
Video Card: HIS Radeon HD 7850
Ram: 12gb mixed OCZ Gold and Kingston HyperX
Case: NZXT Switch 810
My motherboard does have SATA 3 ports on it of course, both Marvell and Intel but I’ve found the Intel ones are much better than the Marvell so that’s what I use mainly and for any testing of course.
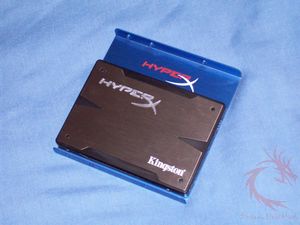
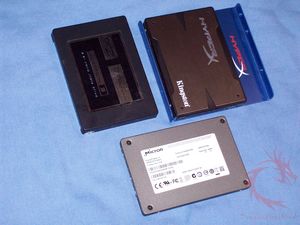
For my installation I used the tray that came with the HyperX SSD. You just need to line the holes up on the tray with the ones on the drive and that’s it.
For comparison I’m putting the HyperX 3K SSD up against the 240gb OCZ Vertex 3 and the 200gb Micron RealSSD P400e.
I also added a three regular mechanical hard drives in the mix, so they all are the Seagate Barracuda XT 2tb SATA6, Samsung Spinpoint F4 HD322GJ 320gb SATA3, Seagate 7200.12 1tb SATA3 drive and the OCZ Vertex 3 SSD and the Micron RealSSD P400e.
So let’s get into the benchmarks and tests as I’ve got a lot of them for you.
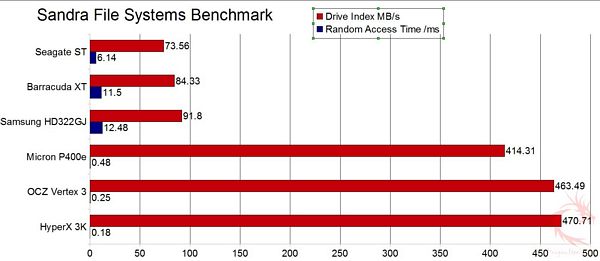
The first test is the File Systems test from SiSoft Sandra 2011:
Benchmark mounted file systems (i.e. volumes).
This is not the raw disk performance that other benchmarks test – but the speed of the volume itself that depends on many more factors like file system, operating system cache, position on disk, etc. Thus this is the performance you get at the file system level.
Read Test: Buffered, Random, Sequential
Write Test: Buffered, Random, Sequential
Seek Test
Drive Score: is a composite figure representing an overall performance rating based on the average of the read, write, and seek tests, and file and cache size. It is intended to represent drive performance under typical use in a PC. A larger number means better performance. The weighting of the results is not equal it represents the distribution of different files sizes as used on these devices (obtained through field research).
Here are some surprising results, well maybe not, but personally I thought the Vertex 3 would come out on top as the fastest but the HyperX is.
Here are the detailed results of the fastest drives:
Samsung F4:
- Detailed Benchmark Results
- Buffered Read : 255MB/s
- Sequential Read : 122MB/s
- Random Read : 48.34MB/s
- Buffered Write : 237.35MB/s
- Sequential Write : 117.82MB/s
- Random Write : 46MB/s
- Random Access Time : 12.48ms
Micron RealSSD P400e:
- Detailed Benchmark Results
- Buffered Read : 448MB/s
- Sequential Read : 455.15MB/s
- Random Read : 445.32MB/s
- Buffered Write : 272.61MB/s
- Sequential Write : 265.39MB/s
- Random Write : 268.61MB/s
- Random Access Time : 48µs
OCZ Vertex 3:
- Detailed Benchmark Results
- Buffered Read : 524.73MB/s
- Sequential Read : 510MB/s
- Random Read : 503.72MB/s
- Buffered Write : 292.68MB/s
- Sequential Write : 287.89MB/s
- Random Write : 286.63MB/s
- Random Access Time : 25µs
Kingston HyperX 3k:
- Detailed Benchmark Results
- Buffered Read : 530.56MB/s
- Sequential Read : 512MB/s
- Random Read : 507.26MB/s
- Buffered Write : 319.61MB/s
- Sequential Write : 316MB/s
- Random Write : 308.73MB/s
- Random Access Time : 18µs
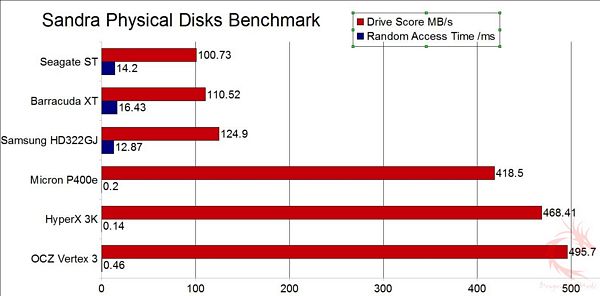
Next up is the Physical Disks test:
Benchmark hard disks (i.e. the disk itself, not the file system). As the test measures raw performance it is independent on the file system the disk uses and any volumes mounted off the disk.
Read Test: Sequential across disk
Write Test: Sequential across disk
Seek Test: random, full stroke
Drive Score: is a composite figure representing an overall performance rating based on the highest read or write speed across the whole disk. Thus the higher the better.
Access Time: is the average time to read a random sector on the disk, analogous to latency response time. Thus the lower the better.
Here the HyperX falls slightly behind the Vertex 3 but still shows very good performance.
Here are the detailed results of the four fastest drives:
Samsung F4:
Drive Score : 124.9MB/s (82.72MB/s – 153.28MB/s) Results Interpretation : Higher scores are better.
Random Access Time : 12.87ms (4.64ms – 11ms) Results Interpretation : Lower scores are better.
Micron RealSSD P400e
Drive Score : 418.5MB/s (361.37MB/s – 432.83MB/s) Results Interpretation : Higher scores are better.
Random Access Time : 198µs (193µs – 190µs) Results Interpretation : Lower scores are better.
OCZ Vertex 3:
Drive Score : 495.7MB/s (490.4MB/s – 506.6MB/s) Results Interpretation : Higher scores are better.
Random Access Time : 46µs (81µs – 77µs) Results Interpretation : Lower scores are better.
Kingston HyperX 3K SSD:
Drive Score : 468.41MB/s (439.86MB/s – 490.74MB/s) Results Interpretation : Higher scores are better.
Random Access Time : 144µs (71µs – 18µs) Results Interpretation : Lower scores are better.


