Testing and Comparison
For testing of course I had to use the same ram and processor as the other boards which is:
Intel E6420
Crucial Ballistix Tracer PC2-8500 2x1gb Kit
There’s no graphic testing here as the vid card is only an Nvidia 6100, and I wasn’t going to pull may cards out for testing. The system as in use doesn’t require any powerful graphics cards, but the chipset etc needs to be compatible and perform well as it does a lot of video capturing which is very CPU intensive. This is an actual upgrade from the original system that was only a single core AMD Processor that ran 100% usage 24/7.
The only tests I ran are SiSoft Sandra and Super PI for comparisons, I was more concerned about CPU, Chipset and Memory performance above all else.
All the tests were run three times each and average out to get the results shown in the charts.
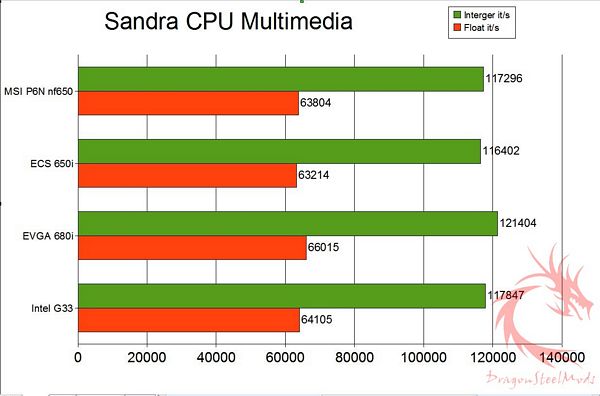
First up would be SiSoft Sandra Processor Multi-Media
Benchmark the (W)MMX, SSE/2/3/4 processor units. Shows how your processors handle multi-media instructions and data. Such operations are used by more specialized software, e.g. image manipulation, video decoders/encoders, and games. The test involves the generation of Mandelbrot Set fractals that are used to realistically describe and generate natural objects such as mountains or clouds. By using various multi-media extensions (Wireless) MMX, 3DNow!, SSE(2/3/4) better performance is achieved. (Higher is better)
Obviously the NF680i chipset is the better choice overall, but when comparing the two 650i chipsets we can see the MSI motherboard fares a bit better than the ECS one does.
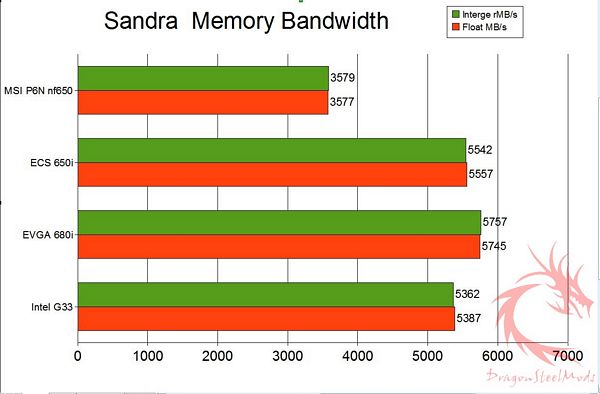
Sandra Memory Bandwidth
Benchmark the memory bandwidth of your computer. Shows how your memory sub-systems compare. The benchmark is based on the well-known STREAM memory benchmark. (Higher is better)
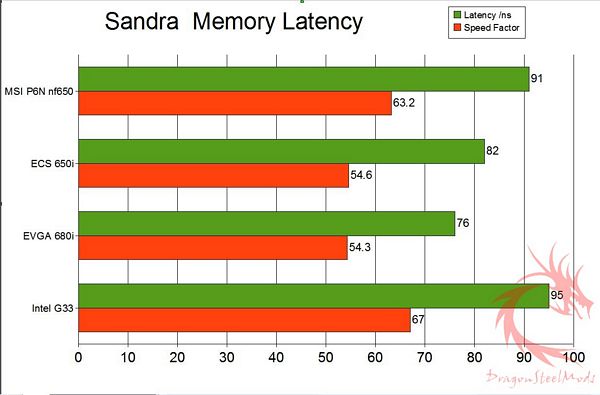
Here we have the results for Sandra Memory Latency
Benchmark the latency (response time) of processors’ caches and memory. Shows how your processors’ caches and memory sub-systems compare. The latency of caches is measured in processor clocks (i.e. how many clocks it takes for the data to be ready) as it is dependent on the processor clock speed.
The latency of memory is measured in nanoseconds as it is typically independent on processor clock speed(lower is better)
I don’t quite know what’s up with this set of tests, I ran these and got very low scores every time, not quite sure why…
Here we have the results for Sandra Memory Latency
Benchmark the latency (response time) of processors’ caches and memory. Shows how your processors’ caches and memory sub-systems compare. The latency of caches is measured in processor clocks (i.e. how many clocks it takes for the data to be ready) as it is dependent on the processor clock speed.
The latency of memory is measured in nanoseconds as it is typically independent on processor clock speed(lower is better)
Even with the same ram, it’s interesting to see how different boards and chipsets perform. Latency is measured in nanoseconds, so really there’s not much of a difference overall between these boards, unless of course your are a uber-enthusiast and need the absolute fastest and best…
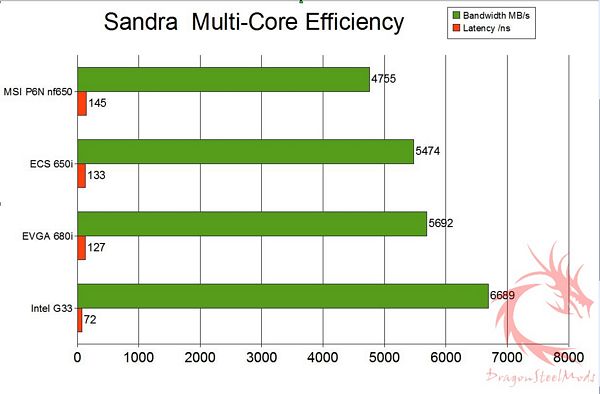
Next up is Sandra Multi-Core Efficiency
Benchmark the multi-core efficiency of the processors. Shows how efficient the processor cores and their inter-connects are in comparison to other types to other typical processors.
The ability of the cores to process data blocks and pass them to another core for processing (producer-consumer paradigm) of different sizes and different chain sizes is measured. The efficiency of the inter-connect between cores is thus benchmarked; however, the number of cores (and processors) also counts as more data buffers can be processed simultaneously (aka “in flight”).
True multi-core processors that have shared L2/L3 caches will thus perform much better than cores that have separate caches and are connected by the traditional FSB.
Inter-Core Bandwidth :Results Interpretation : Higher index values are better.
Inter-Core Latency :Results Interpretation : Lower index values are better
Surprisingly the Intel Chipset performs the best here overall…
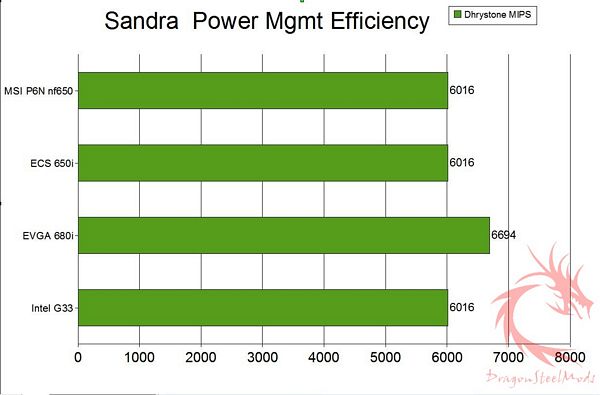
Now we have Sandra Power Management Efficiency
Benchmark the power management efficiency of the processors. Shows how efficient the power management of your processors is. The ability of the processors to step-down in frequency and voltage at different workloads is measured. The more a processor steps down in both frequency and voltage the better the score at the specific workload. The test stops when the workload is too great the processor even at 100% efficiency.
The ALU/FPU score is a geometric mean based on the whole range of workloads; thus the power of the processor does matter in obtaining a higher score.
The Power Efficiency score is a geometric mean based on the supported workloads only. Thus the power of the processors does not matter. (Higher is better)
There’s no surprise here, the NF680i chipset is the better of them at power management
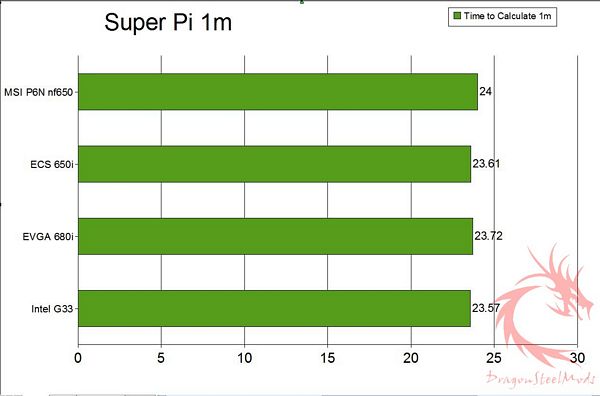
The final test is Super Pi calculated to 1 million places, of course lower score is better, meaning less time to calculate.
Less than a second more to complete the calculations, not bad, something that I think many people would never notice in the ‘real world’

